- Python Web - Django Framework
- Django Framework - Overview
- Django Framework - Users
- Django Framework - Installation
- Django Framework - Creating Application
- Python Web - Flask Framework
- Python Web - Flask Framework
- Flask Framework - Creating URL Routing
- Flask Framework - Using Templates
- Python Web - Pyramid Framework
- Python Web - Pyramid Framework
- Pyramid Framework - Core Concepts
- Pyramid Framework - Creating Application
- Python Web - Dash Framework
- Python Web - Dash Framework
- Dash Framework - App Layout
- Dash Framework - HTML Component
- Dash Framework - Visualization
- Python Web - py4web Framework
- Python Web - py4Web Framework
- py4web Framework - Dashboard
- py4web Framework - Creating Application
- Python Web - Miscellaneous
- Python Web - Web2py Framework
- Python Web - Choosing a Better Framework
- Python Web Development Libraries Resources
- Python Web - Quick Guide
- Python Web - Useful Resources
- Python Web - Discussion
Dash Framework - Visualizations
The dcc library includes a component called Graph.
Graph renders interactive data visualizations using the open source plotly.js JavaScript graphing library. Plotly.js support around 35 chart types and renders charts in both vector-quality SVG and high-performance WebGL.
Example - Creating a Scatter Plot
Below is an example that creates a scatter plot from a Pandas dataframe −
main.py
import dash
from dash import dcc
from dash import html
import pandas as pd
import plotly.graph_objs as go

app = dash.Dash()

df = pd.read_csv(
   'https://gist.githubusercontent.com/chriddyp/' +
   '5d1ea79569ed194d432e56108a04d188/raw/' +
   'a9f9e8076b837d541398e999dcbac2b2826a81f8/'+
   'gdp-life-exp-2007.csv')

app.layout = html.Div([
   dcc.Graph(
      id='life-exp-vs-gdp',
      figure={
         'data': [
            go.Scatter(
               x=df[df['continent'] == i]['gdp per capita'],
               y=df[df['continent'] == i]['life expectancy'],
               text=df[df['continent'] == i]['country'],
               mode='markers',
               opacity=0.7,
               marker={
                  'size': 15,
                  'line': {'width': 0.5, 'color': 'white'}
               },
               name=i
            ) for i in df.continent.unique()
         ],
         'layout': go.Layout(
            xaxis={'type': 'log', 'title': 'GDP Per Capita'},
            yaxis={'title': 'Life Expectancy'},
            margin={'l': 40, 'b': 40, 't': 10, 'r': 10},
            legend={'x': 0, 'y': 1},
            hovermode='closest'
         )
      }
   )
])

if __name__ == '__main__':
   app.run()
Output
The output of the above code is as follows −
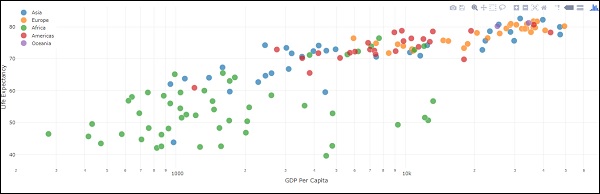
These graphs are interactive and responsive. You can hover over points to see their values, click on legend items to toggle traces, click and drag to zoom, hold down shift, and click and drag to pan.
Markdown
While dash exposes HTML flavours through the html library, it can be tedious to write your copy in HTML. For writing blocks of texts, you can use the Markdown component in the dcc library.
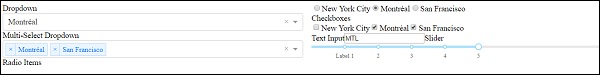
Core Components
The dcc library includes a set of higher-level components like dropdowns, graphs, markdown, blocks and many more.
Like all other Dash components, they are described entirely declaratively. Every option that is configurable is available as a keyword argument of the component.
Below is the example, using some of the available components −
main.py
# -*- coding: utf-8 -*-
import dash
from dash import dcc
from dash import html

app = dash.Dash()

app.layout = html.Div([
   html.Label('Dropdown'),
   dcc.Dropdown(
      options=[
         {'label': 'New York City', 'value': 'NYC'},
         {'label': u'Montral', 'value': 'MTL'},
         {'label': 'San Francisco', 'value': 'SF'}
      ],
      value='MTL'
   ),

   html.Label('Multi-Select Dropdown'),
   dcc.Dropdown(
      options=[
         {'label': 'New York City', 'value': 'NYC'},
         {'label': u'Montral', 'value': 'MTL'},
         {'label': 'San Francisco', 'value': 'SF'}
      ],
      value=['MTL', 'SF'],
      multi=True
   ),

   html.Label('Radio Items'),
   dcc.RadioItems(
      options=[
         {'label': 'New York City', 'value': 'NYC'},
         {'label': u'Montral', 'value': 'MTL'},
         {'label': 'San Francisco', 'value': 'SF'}
      ],
      value='MTL'
   ),

   html.Label('Checkboxes'),
   dcc.Checklist(
      options=[
         {'label': 'New York City', 'value': 'NYC'},
         {'label': u'Montral', 'value': 'MTL'},
         {'label': 'San Francisco', 'value': 'SF'}
      ],
      values=['MTL', 'SF']
   ),

   html.Label('Text Input'),
   dcc.Input(value='MTL', type='text'),

   html.Label('Slider'),
   dcc.Slider(
      min=0,
      max=9,
      marks={i: 'Label {}'.format(i) if i == 1 else str(i) for i in range(1, 6)},
      value=5,
   ),
], style={'columnCount': 2})

if __name__ == '__main__':
   app.run_server(debug=True)
Output from the above program is as follows −
Calling Help
Dash components are declarative. Every configurable aspect of these components is set during installation as a keyword argument. You can call help in your python console on any of the components to learn more about a component and its available arguments. Some of them are given below −
>>> help(dcc.Dropdown)
Help on class Dropdown in module builtins:
class Dropdown(dash.development.base_component.Component)
| A Dropdown component.
| Dropdown is an interactive dropdown element for selecting one or more

| items.
| The values and labels of the dropdown items are specified in the `options`
| property and the selected item(s) are specified with the `value` property.
|
| Use a dropdown when you have many options (more than 5) or when you are
| constrained for space. Otherwise, you can use RadioItems or a Checklist,
| which have the benefit of showing the users all of the items at once.
|
| Keyword arguments:
| - id (string; optional)
| - options (list; optional): An array of options
| - value (string | list; optional): The value of the input. If `multi` is false (the default)
-- More --
To summarize, the layout of a Dash app describes what the app looks like. The layout is a hierarchical tree of components. The html library provides classes for all the HTML tags and the keyword arguments, and describes the HTML attributes like style, className, and id. The dcc library generates higher-level components like controls and graphs.